


 Withdrawal
 Payment / Shipping

 Contact
 Newsletter
 Product registration


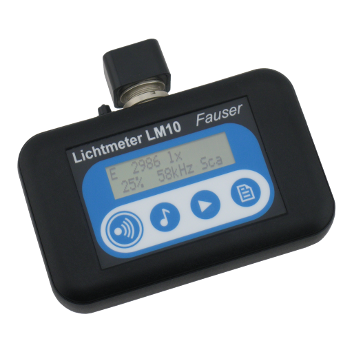
Lightmeter LM10
- measurement device for assessment of light quality
- display of illuminance
- flicker% or ripple content and frequency in the range from 50 Hz up to 400 kHz
- acoustic reproduction of the flicker in audible range and in ultrasound range
- sensors for visible spectrum, infrared and ultraviolet range
- microphone measuring head makes the noise of light sources in the ultrasound range audible
- data logger for continuous recording and single-point measurement with 1 GByte storage capacity including software FM-Data
LM10 - multi-analyzer for illumination
The light meter LM10 is a new innovate product for examination of light sources for their quality. Thereby, the parameters illuminance, flicker frequency and flicker component - or ripple content - are measured. In addition, the flickers of the light source can be represented acoustically in the audible as well as in ultrasound range using a loudspeaker.
At optional voltage output, oscilloscope or spectrum can be connected for displaying brightness curve or frequency spectrum.
In addition, the Lightmeter LM10L has an integrated data logger with 1 GByte data storage and a real-time clock for precise time-/date specification.
The logger has two operating modes: The permanent mode for long-term measurements and single-point measurement for specific recordings.
The download of saved measured values and the settings of LM10L-functions on the PC are done via USB-interface. The software FM-Data is used for processing and documentation of the logged measurement values.
Universally by different measuring probes
The Lightmeter LM10 is suitable for various measurements in lighting analysis through different measuring probes.
Thus, the probes can be set for the spectrum of visible light as well as infrared und ultraviolet range.
Acoustic reproduction
Lightmeter LM10 provides an option to make the flickers of light sources audible using an integrated loudspeaker. In addition to the flickers in audible frequency range, flicker frequencies of up to 400 kHz can also be transformed to audible range manually or automatically. Also an audio signal can be connected, proportional to the illuminance or the flickers.
Multifunctional display
In high-contrast and illuminated display, there is simultaneous display of illuminance, flicker% or ripple content and frequency.
In addition, the infrared and ultraviolet range or ultrasonic can be displayed using optional measuring probes.
![]() Display of illuminance, flicker% and frequency
Display of illuminance, flicker% and frequency
![]() Lightmeter LM10 in audio modefor ultrasound. The currently audible flicker frequency is displayed.
Lightmeter LM10 in audio modefor ultrasound. The currently audible flicker frequency is displayed.
Managing measured data with FM-Data
The scope of delivery of the Lightmeter with data logger LM10L/LS contains the program FM-Data. This program is constantly developed to adapt to the needs of our customers. This service is available to you in the form of free of charge updates at any time!
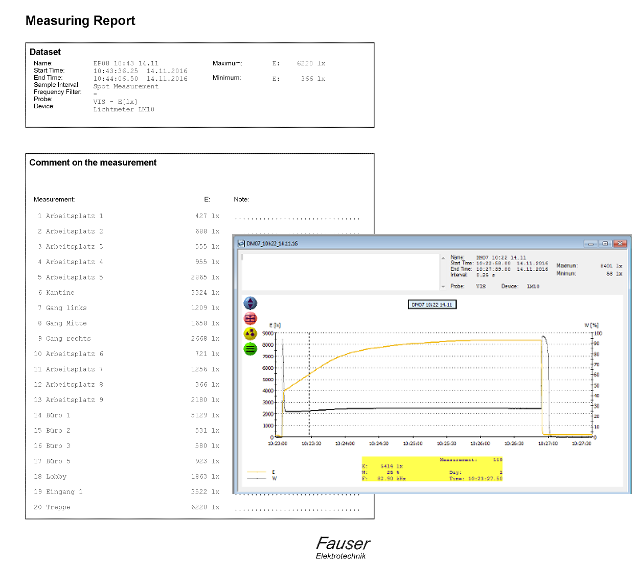
Protocol and measurement diagram as print versions
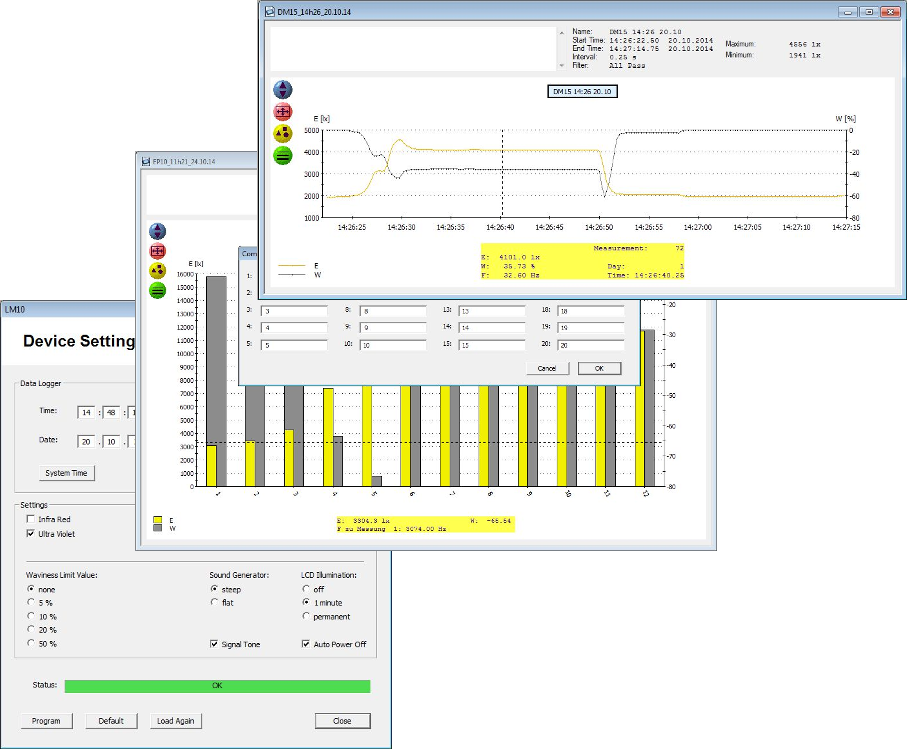
The FM-Data enables the user to display the device settings of the Lightmeter LM10L/LS, adjust settings like measurement interval or limits and transfer the new setup to the Lightmeter LM10L/LS.
FM-Data provides a clear management of the data storage of the Lightmeter LM10L/LS. The stored data sets are displayed and can be loaded or deleted.
The data set window shows some information like the start and the end of the record, the sample interval as well as the minimum and maximum values. With the help of the mouse the measurement value and the time stamp of each sample can be called up in the diagram.
Important occurrences in the record can be displayed enhanced in the diagram by performing a zoom.
Dialogue windows enable the user to make own comments on the respective data set and to each measured point regarding a single-point record.
The edited data sets can be printed as a measurement protocol or as a diagram.
Moreover, an export function to include the readings in other applications such as chart and data base programs is supported.
Additionally, the storage of the measurement diagrams as an graphic data is possible.